
Free Multiplication Chart to Print
A multiplication chart is the quickest reference for times tables and number patterns. Choose the size — 10 × 10, 12 × 12, 15 × 15 or 20 × 20 — pick a colour style, highlight the square numbers or one table, and optionally blank out some or all of the answers to turn the chart into a practice sheet. Then print it free.
- Free to use
- No sign-up
- Runs in your browser
Multiplication chart maker
Multiplication Chart Pack
Printable multiplication charts (1–10, 1–12, 1–15, 1–20) in colour and black and white, blank grids for practice, a skip-counting strip and a times tables progress tracker.
- Chart 1–10 (PDF/XLSX)
- Chart 1–12 (PDF/XLSX)
- Chart 1–15 (PDF/XLSX)
- Chart 1–20 (PDF/XLSX)
- Blank 10×10 grid (PDF)
- Blank 12×12 grid (PDF)
- Skip counting (PDF)
- Tracker (PDF/DOCX)
Formats: PDF, XLSX, DOCX. Instant download after payment (link valid 72 hours, up to 5 downloads). AI-assisted: the templates were drafted with AI help and reviewed and laid out before publishing.
$5.00 USD, one-time 8 files · about $0.63 each
- Instant download
- 7-day refund
- Secure checkout by Stripe
7-day money-back guarantee. Full refund within 7 days of purchase, even after you download.
Free sample: Blank Grid 10x10 (PDF, 58 KB)
Full refund within 7 days — see the refund policy and license.
Free printables
Single sheets you can print right now, no sign-up. The full pack adds every sheet in one download plus the editable files.
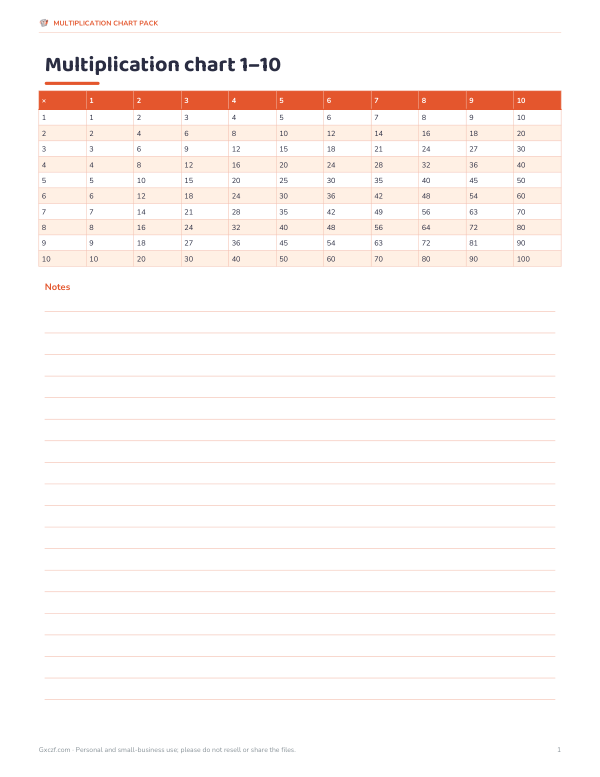 Printable Multiplication Chart 1 to 101 page · free PDF
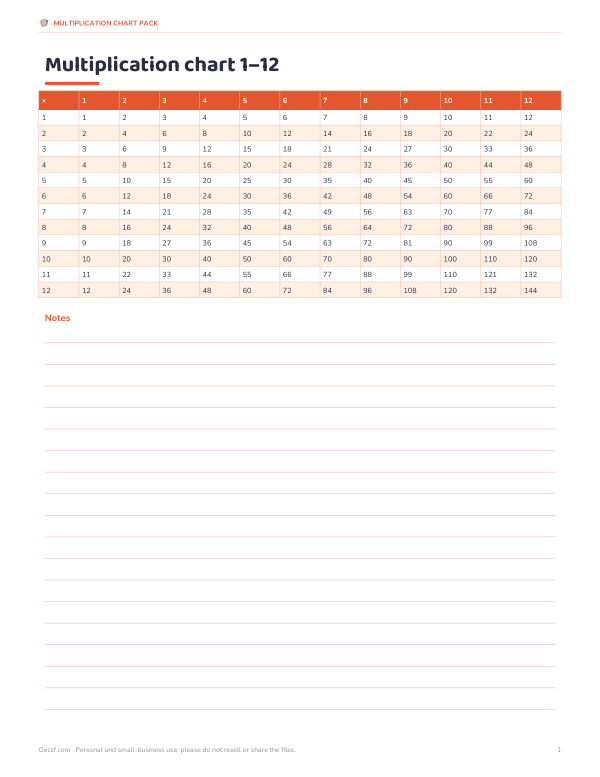 Printable Multiplication Chart 1-121 page · free PDF
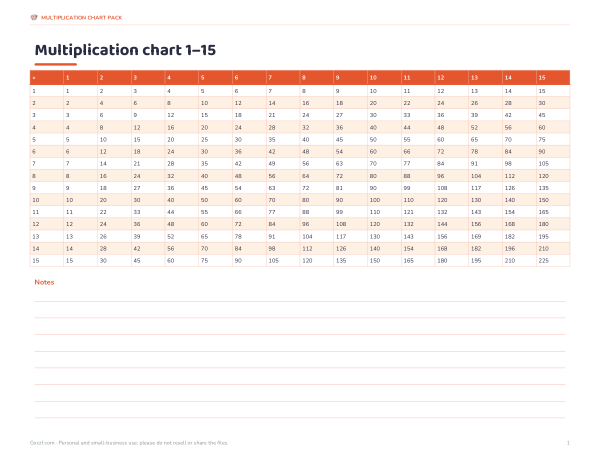 Printable Multiplication Chart 1-151 page · free PDF
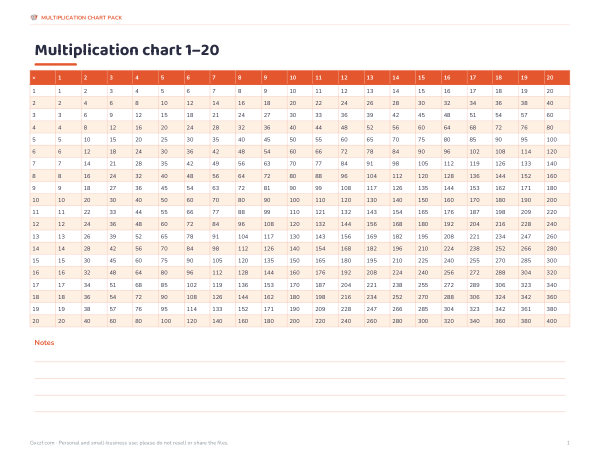 Printable Multiplication Chart 1 to 201 page · free PDF
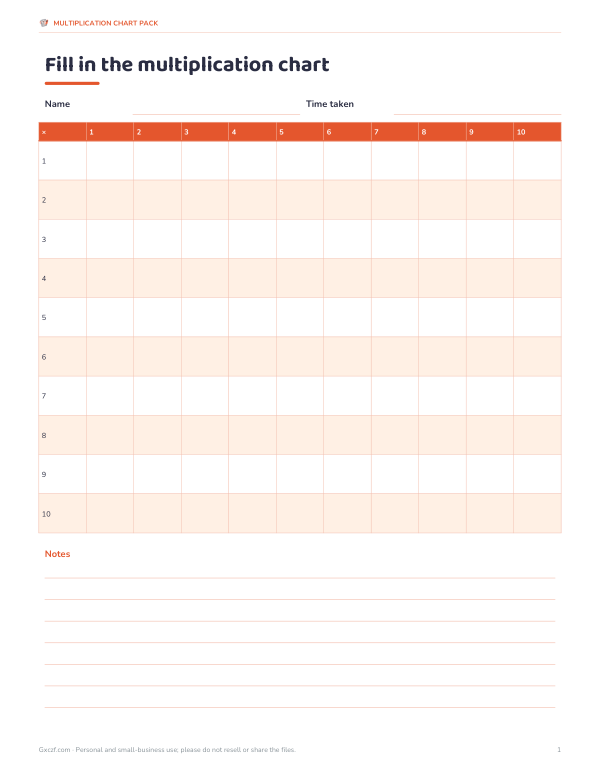 Printable Blank Multiplication Chart1 page · free PDF
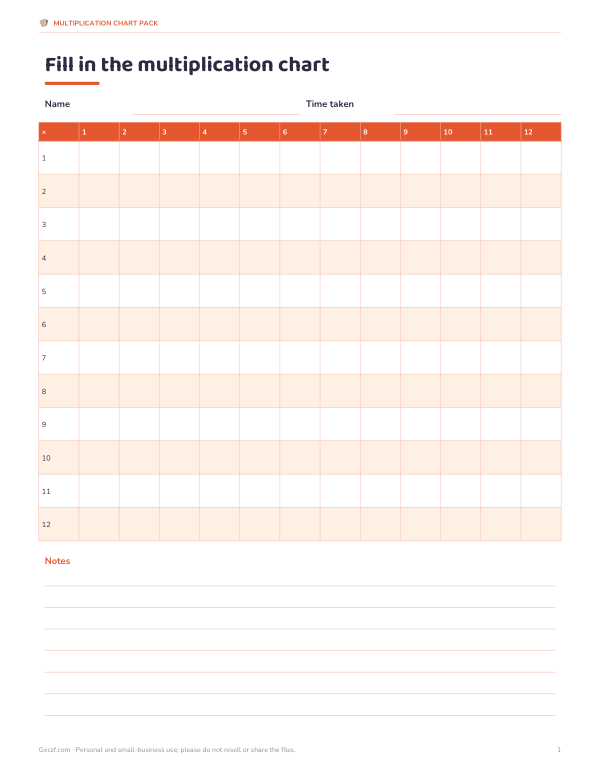 Printable Blank 12x12 Multiplication Grid1 page · free PDF
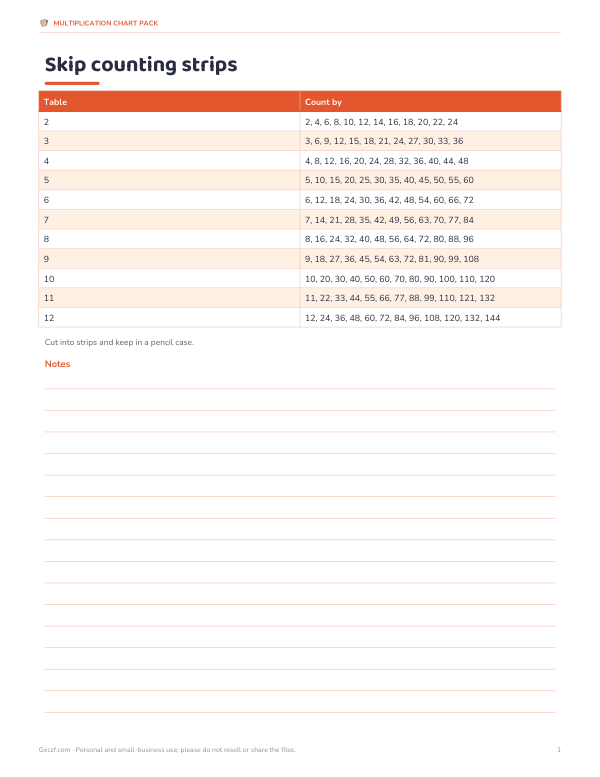 Printable Skip Counting Strips1 page · free PDF
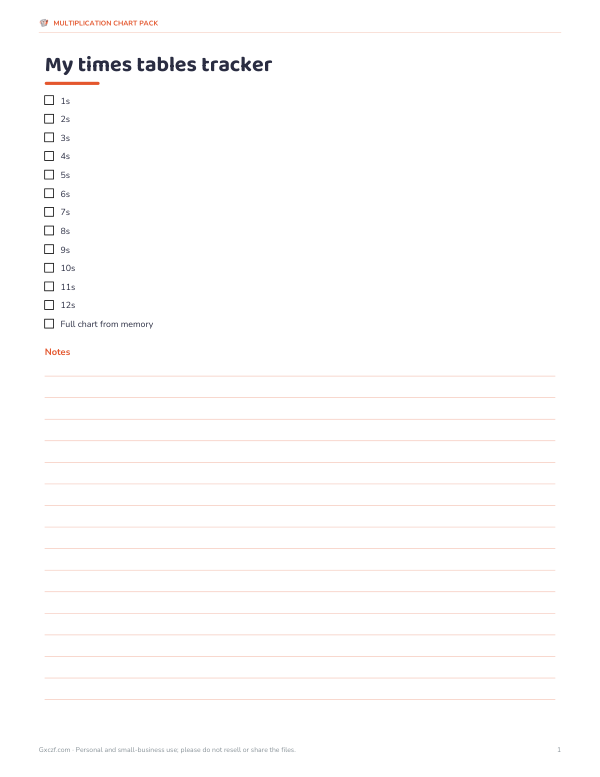 Printable Multiplication Tracker1 page · free PDF
How to read a multiplication chart
Find the first number down the left column and the second number along the top row. The answer is where that row and column meet. For 6 × 8, go down to row 6 and across to column 8: the cell shows 48. Because multiplication is commutative, 8 × 6 gives the same answer, which is why the chart is symmetrical along the diagonal from top-left to bottom-right.
Which size to print
| Size | Best for |
|---|---|
| 1–10 | Young learners; the core 100 facts |
| 1–12 | Most school curricula (UK, Australia, many US schools) |
| 1–15 | Extension work and mental maths challenges |
| 1–20 | Older students, estimating and number patterns |
Larger charts print in landscape so the numbers stay readable. For a classroom wall, print the 12 × 12 chart on A3 or tile it across several pages with your printer’s poster setting.
Patterns to look for
- Square numbers (1, 4, 9, 16, 25…) run along the diagonal — use the “Highlight square numbers” style to see them.
- Symmetry — every fact appears twice, once on each side of the diagonal.
- The 9s — digits of each answer add to 9 up to 9 × 10.
- Even rows — the 2, 4, 6, 8 and 10 rows contain only even numbers.
- The 5s end in 0 or 5; the 10s end in 0.
- The 11s repeat the digit up to 11 × 9.
Using the chart for practice
- Start with the full chart as a reference while doing homework.
- Print with 25% blanks and fill them in, then check against a full chart.
- Move to 50% blanks, then a completely blank grid.
- Highlight one table at a time — say the 7s — and practise just that row.
- Time how long it takes to fill in a blank 10 × 10 grid; try to beat your record.
Press “New blanks” to get a different set of empty cells each time, so children can’t just remember the positions.
Worked example
A teacher prints a 12 × 12 chart with the 7 times table highlighted for the class wall, and a 10 × 10 chart with 50% blanks for each pupil. Pupils fill in the blanks using patterns — for example, knowing 7 × 5 = 35 and adding 7 to find 7 × 6 = 42 — then compare with the wall chart. A week later, the same class tries a fully blank 10 × 10 grid.
Chart or worksheets?
A chart is a reference: it shows every fact at once and helps children spot patterns. Worksheets test recall in random order. Most children benefit from both — the chart early on to build understanding and confidence, and worksheets or games later to build speed. Gradually using the chart less is a good sign that facts are becoming memorised.
Strategies for the harder facts
| Fact | Strategy |
|---|---|
| 6 × 7 = 42 | Double 3 × 7 = 21 |
| 7 × 8 = 56 | “5, 6, 7, 8” — 56 = 7 × 8 |
| 6 × 8 = 48 | Double 3 × 8 = 24 |
| 8 × 8 = 64 | Double, double, double: 8 → 16 → 32 → 64 |
| 7 × 7 = 49 | A square number on the diagonal |
| 9 × 7 = 63 | Ten sevens minus one seven: 70 − 7 |
| 12 × 6 = 72 | Ten sixes plus two sixes: 60 + 12 |
Most children find the 6, 7 and 8 tables hardest because they have the fewest shortcuts. Using known facts — doubling, halving and “ten times minus one” — turns them into easier steps.
Games to play with the chart
- Four in a row — two players take turns choosing two numbers to multiply and cover the answer; first to get four in a row wins.
- Treasure hunt — call out a product such as 24 and find every cell that contains it (3 × 8, 4 × 6, 6 × 4, 8 × 3…).
- Race the diagonal — say the square numbers aloud as fast as you can.
- Mystery number — cover a cell and ask for the missing product.
Printing tips
Choose portrait for sizes up to 12 and landscape for 15 and 20 (the print button sets this automatically). If colours don’t print, enable “Background graphics” in the print dialog. For long-lasting charts, laminate them or slip them into a plastic sleeve so children can use dry-wipe pens on the blank versions.
Free to use
The chart maker is free to use and print for home and classroom use. The optional pack adds ready-made charts in several sizes and styles, blank grids, a skip-counting strip and a times-table tracker.
Privacy
The chart maker runs in your browser; nothing is uploaded.
Frequently asked questions
Is the multiplication chart free to print?
Yes, make and print as many as you like.
What size chart should I use?
A 12 × 12 chart suits most school curricula; 10 × 10 for younger children.
Can I make a blank chart?
Yes, choose All in Blank cells to get an empty grid to fill in.
Why is the chart symmetrical?
Because a × b = b × a, every product appears on both sides of the diagonal.
Can I highlight a single times table?
Yes, choose Highlight one table and enter the number.
Why do some numbers appear many times?
Numbers with many factors, such as 12, 24 and 36, appear wherever two factors multiply to them.
Should I laminate the chart?
Laminating lets children write on blank versions with dry-wipe pens and reuse them.
What is the biggest number on a 12 × 12 chart?
144, which is 12 × 12.
How do I print a large chart?
Sizes over 12 print in landscape; use A3 or poster printing for a wall chart.
Is anything uploaded?
No, it runs in your browser.